
Islington Ranks 50th in National Deprivation Index
Key Findings
-
- Islington has moved from the 41st most deprived local authority in England in 2019 to 50th most deprived in 2025 (out of 153 local authorities).
- Islington is now the 8th the most deprived local authority in London (it was 6th in 2019).
- Islington ranks among the five most deprived local authorities in England for income deprivation affecting older people.
- Islington’s rank for income deprivation affecting children has improved from 10th in 2019 to 16th nationally in 2025.
- Out of the seven domains used to calculate deprivation, only the health and living environment have seen a worsening in deprivation ranking
Index of Multiple Deprivation 2025
The English Indices of Deprivation (IMD) 2025 are the official measure of relative deprivation in England. They are constructed using 55 separate indicators, which capture different aspects of deprivation experienced by people living in small areas known as Lower-layer Super Output Areas (LSOAs). Each LSOA is ranked from 1 (most deprived) to 33,755 (least deprived), enabling comparisons across neighbourhoods and local authorities
These indicators are grouped into seven domains:
-
-
- Income
- Employment
- Education
- Health
- Crime
- Barriers to Housing and Services
- Living Environment
-
Comparisons using the IMD are relative, not absolute
We cannot compare whether Islington has become more or less deprived over time due to changes in the methodology, geography, and data sources. These changes mean the IMD scores from 2019 and 2025 are not directly comparable.
The index also measures deprivation alone; it does not assess wealth or affluence. Therefore, we cannot say Islington has become more affluent, only it is less deprived compared to other places.
The IMD2025 can be used to identify the most deprived neighbourhoods and relatively compare areas across England, explore the domains (or types) of deprivation, and compare larger administrative areas e.g. wards.
The IMD cannot be used to quantify how deprived a neighbourhood is, identify deprived people or levels of affluence or measure absolute change in deprivation over time
Deprivation in Islington
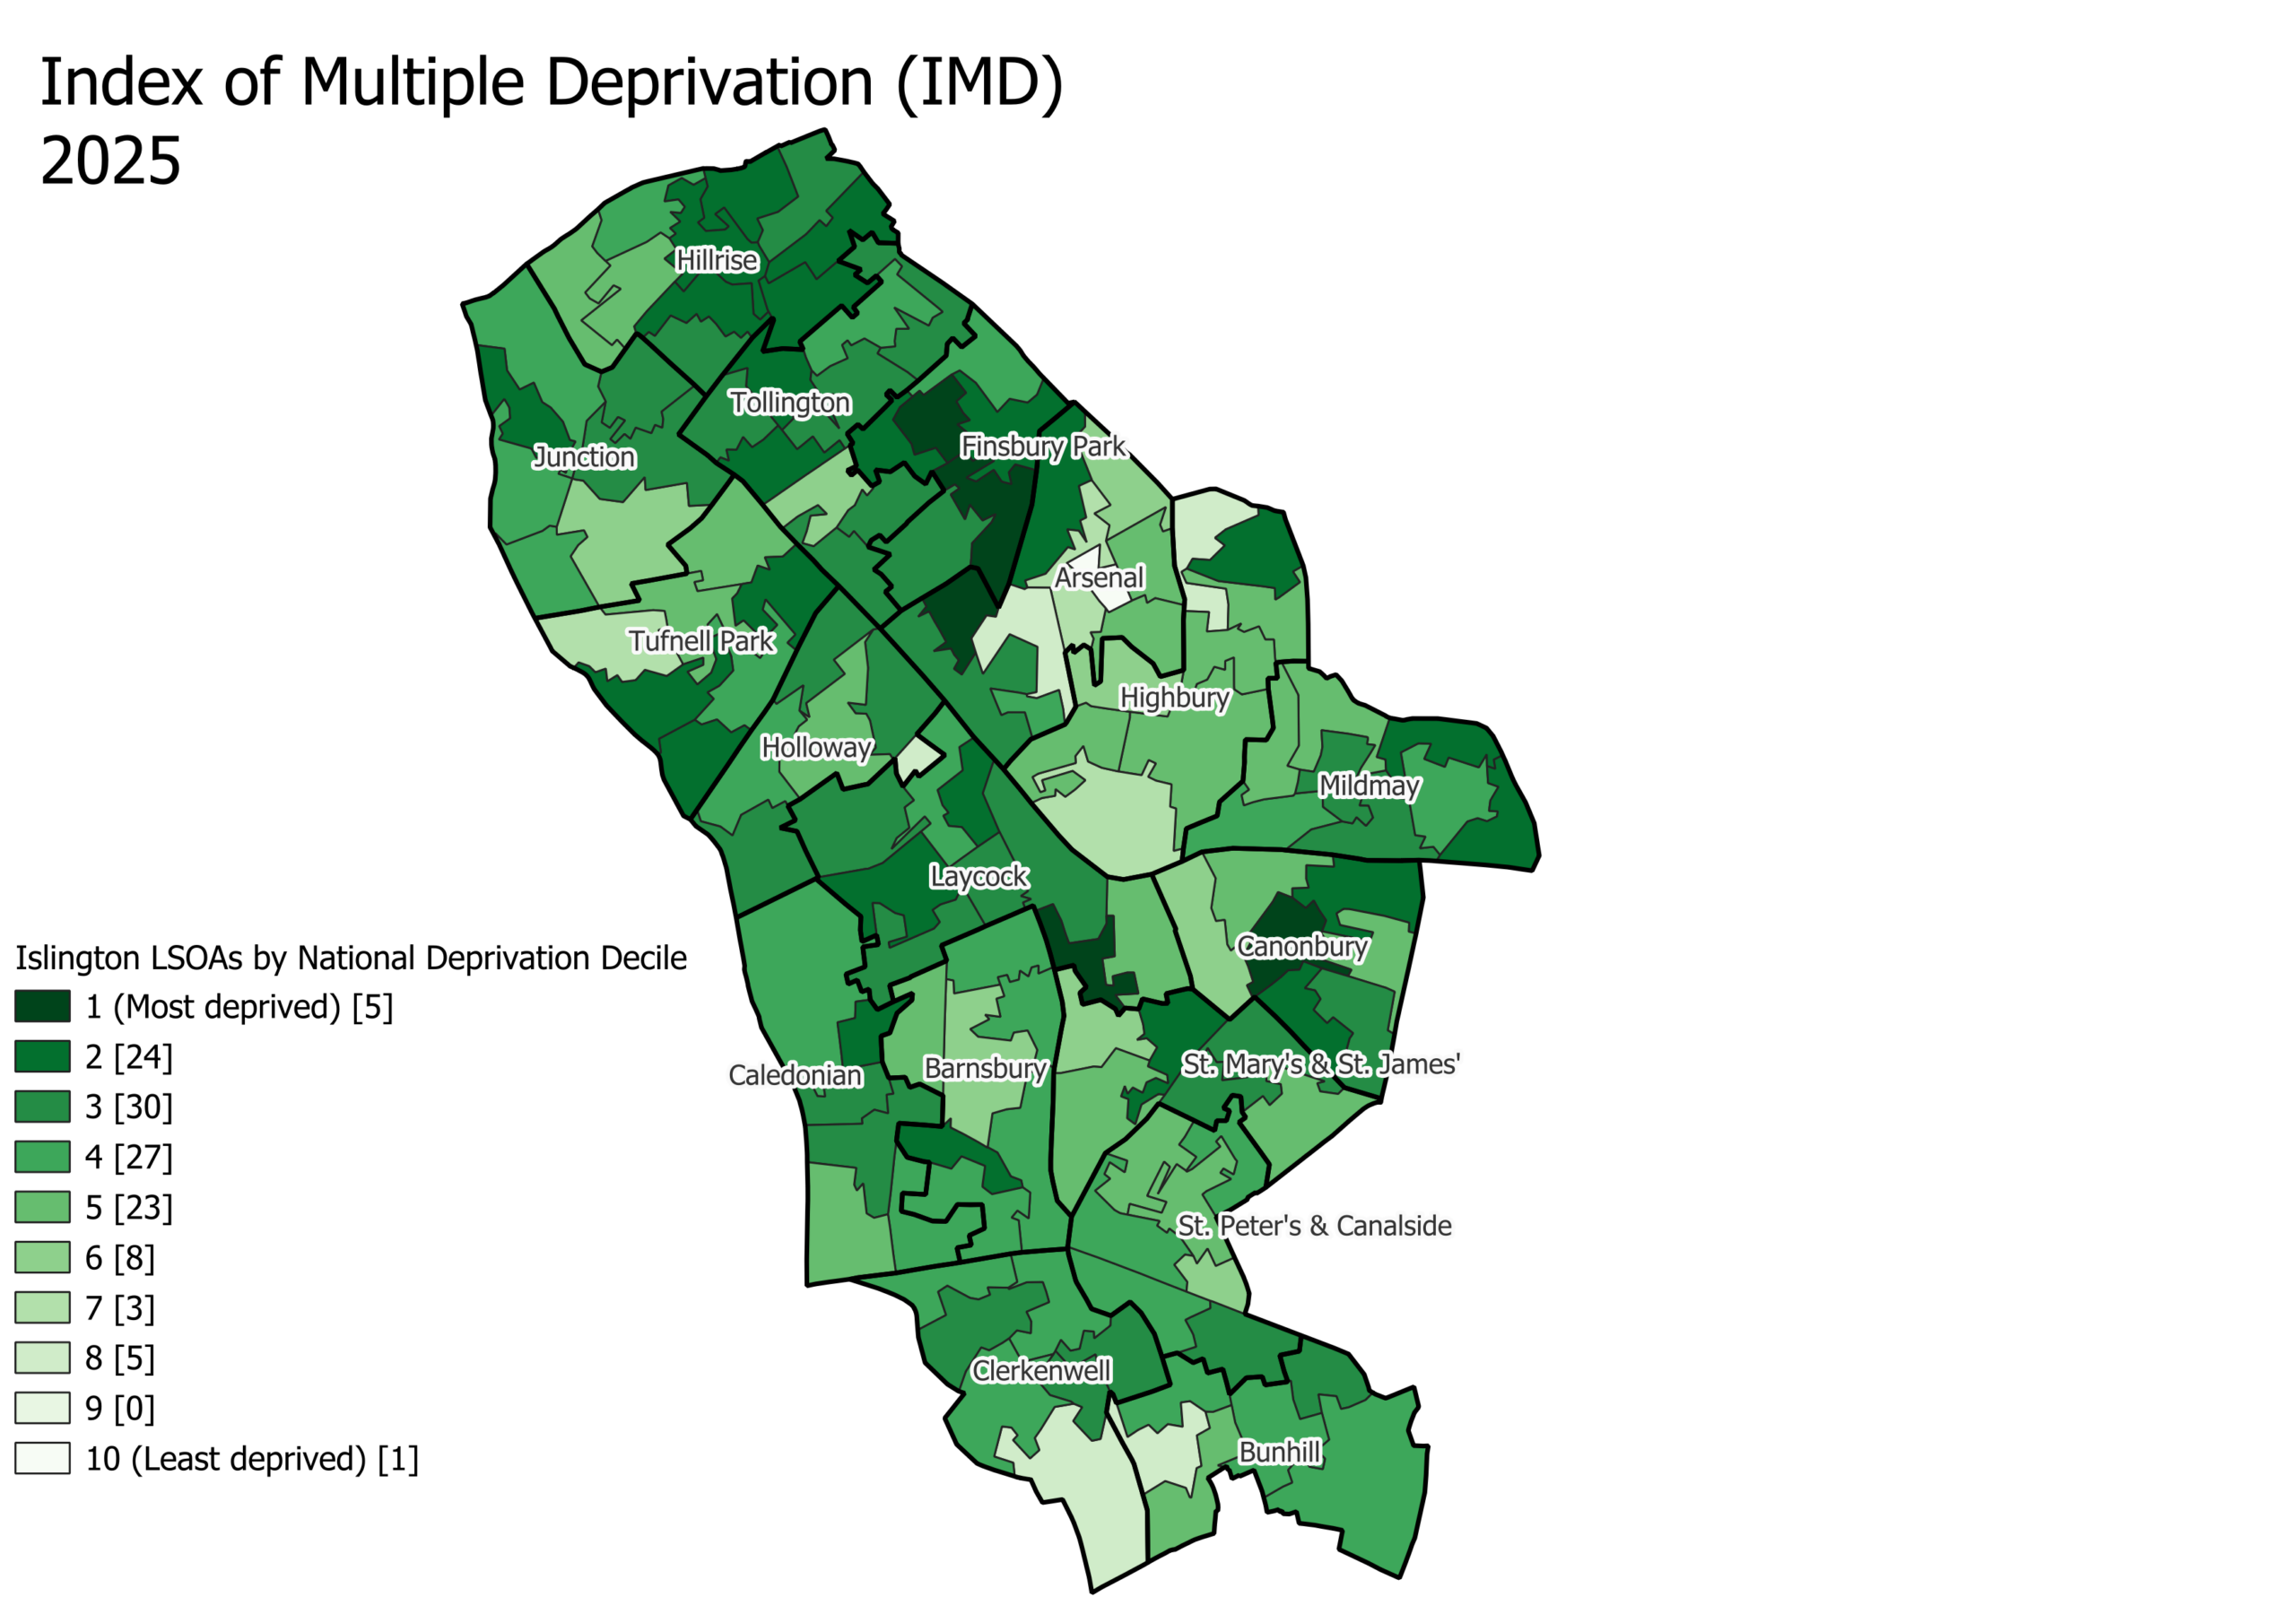
Islington is a borough of notable contrasts. Pockets of deprivation are found throughout the borough. For example, in the Arsenal ward, one LSOA ranks among the 10% most deprived nationally, whilst another nearby LSOA falls within the 10% least deprived. Similarly, several LSOAs in the top 20–30% for deprivation are neighbour areas ranked in the least deprived 30%. In total Islington has 5 LSOAs in the top 10% most deprived, these are found in Arsenal, Finsbury Park, Laycock, and Canonbury.
Map 1: Map of Islington LSOAs, by national deprivation deciles, 2025 IMD
Changes in deprivation
The 2025 Index shows a relative improvement in Islington’s overall deprivation ranking. The borough has moved from 41st to 50th nationally, driven by a number of LSOAs showing significantly improved rankings compared to the previous year. In 2025, 23% of Islington’s LSOAs fall within the two most deprived deciles nationally, down from 26% in 2019. At the same time, there has been growth in the least deprived deciles, including one LSOA in Arsenal now ranking among the least deprived 10% nationally. As the index measures relative deprivation, this shift does not confirm that people living in Islington are more or less deprived in 2025 compared to 2019. It may reflect improvements in Islington, worsening conditions elsewhere, or a combination of both.
Ward and neighbourhood level analysis
The IMD 2025 publication does not include analysis by ward, however average scores for each Islington ward have been calculated in Table 1. These figures show that Finsbury Park has the highest level of deprivation in Islington.
Table 1: Rank and average deprivation score using the IMD 2025 IMD, Islington wards, approximate calculations
| Rank of Islington Wards (1 is most deprived) | Ward | Population-weighted average 2025 IMD score |
|---|---|---|
| 1 | Finsbury Park | 35.1 |
| 2 | Hillrise | 31.8 |
| 3 | Canonbury | 30.6 |
| 4 | Laycock | 30.3 |
| 5 | Tollington | 28.5 |
| 6 | Caledonian | 27.8 |
| 7 | Mildmay | 27.1 |
| 8 | Tufnell Park | 26.6 |
| 9 | Junction | 26.4 |
| 10 | Holloway | 25.5 |
| 11 | St Mary’s & St James’ | 25.1 |
| 12 | Arsenal | 24.3 |
| 13 | Clerkenwell | 23.8 |
| 14 | Barnsbury | 23.0 |
| 15 | Bunhill | 22.9 |
| 16 | St Peter’s & Canalside | 22.7 |
| 17 | Highbury | 18.4 |
Note: These figures have been calculated based on the average score of the LSOAs in each ward.
Domains
Islington’s IMD rank has moved from the 41st most deprived local authority in England in 2019 to 50th most deprived in 2025 (out of 153 local authorities).
Looking at the individual domain rankings, 3 domains increased their rank (became relatively less deprived), with the largest increase seen in Barriers to Housing and Services (+20) second to this was Crime (+16).
2 domains remained the same with no change in rank. 2 domains decreased in rank (relatively more deprived). These were Health Deprivation and Disability and Living Environment Deprivation. Health Deprivation and Disability, which looks at premature death, emergency hospital admissions, illness and disability and mental ill health, shows the largest decrease in rank (-8).
Following on from this briefing, we will be completing a deep-dive into the IMD scores and part of this will include a review of how changes in the indicators included within each domain might have impacted ranking (e.g. the substantial change in ranking seen for the barriers to housing and services domain).
Table 2: Rank of domains compared to all upper tier local authorities and change in rank, IMD 2019 and 2025
| Indicator Domain | 2019 Rank | 2025 Rank | Change in Rank (positive improved, negative getting worse) |
|---|---|---|---|
| Overall IMD | 41 | 50 | +9 |
| Income Deprivation | 30 | 33 | +3 |
| Employment Deprivation | 56 | 56 | 0 |
| Education, Skills and Training Deprivation | 128 | 128 | 0 |
| Health Deprivation and Disability | 58 | 50 | -8 |
| Crime | 18 | 34 | +16 |
| Barriers to Housing and Services | 26 | 46 | +20 |
| Living Environment Deprivation | 17 | 12 | -5 |
Note: Rank 1 is the most deprived upper tier local authority, rank 153 is the least deprived upper tier local authority.
Table 3: Rank of supplementary indices compared to all upper tier local authorities and change in rank IMD 2019 and 2025
| Indicator Domain | 2019 Rank | 2025 Rank | Change in Rank (positive improved, negative getting worse) |
|---|---|---|---|
| Income Deprivation Affecting Children Index (IDACI) | 10 | 16 | +6 |
| Income Deprivation Affecting Older People Index (IDAOPI) | 4 | 4 | 0 |
Income Deprivation Affecting Children Index (IDACI)
Islington ranks as the 16th most deprived local authority in England for the income deprivation affecting children index. This is a relative improvement in rank compared to 2019 (10th most deprived). There have been methodology changes in the IDACI calculation since 2019 which may explain the increase in rank seen. These include the changing of the threshold for a household to be defined as ‘income deprived’ to be based on a monthly income of less than 70% of the national median monthly income after housing costs, instead of the previous 60%.
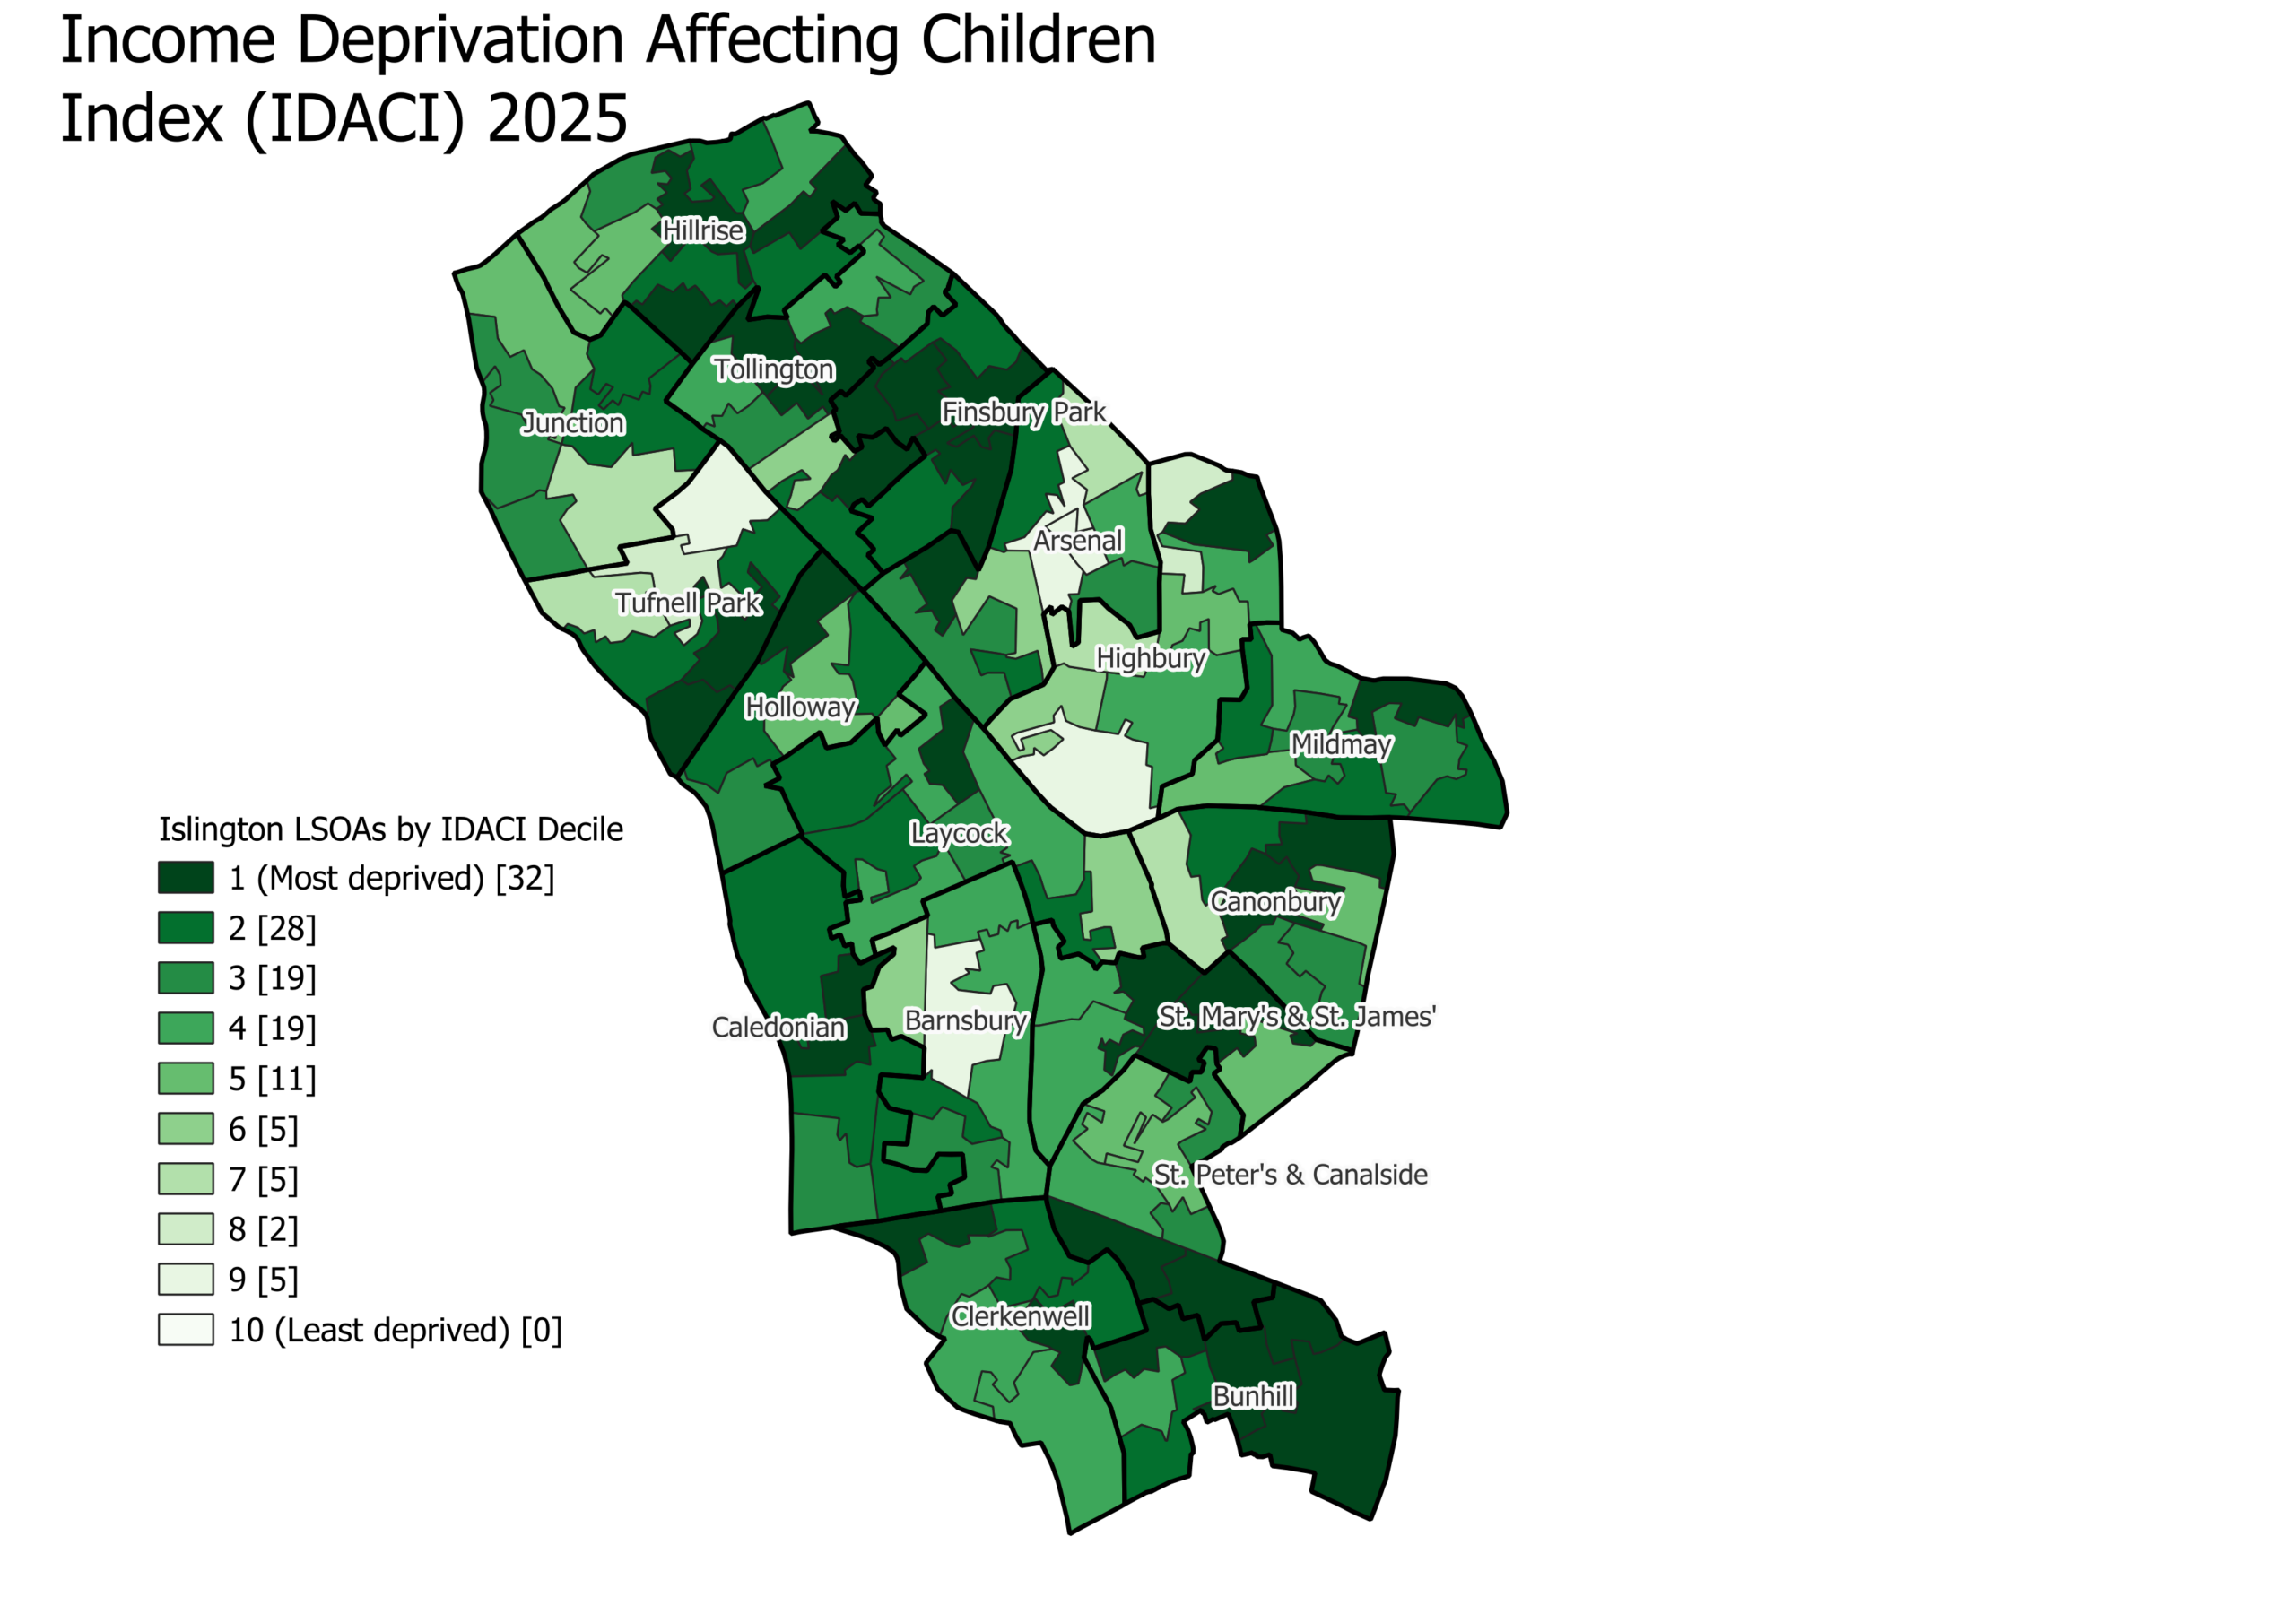
In 2025, 48% of LSOAs in Islington were in the top 2 most deprived deciles for IDACI and none were in the least deprived decile. In 2019, 56% of LSOAs were in the top 2 most deprived deciles and none were in least deprived deciles 8, 9 or 10.
Map 2: Map of Islington IDACI by LSOAs, by national deprivation deciles, 2025 IMD
Income Deprivation Affecting Older People Index (IDAOPI)
Islington ranks among the five most deprived local authorities in England for income deprivation affecting older people, alongside Tower Hamlets, Hackney, Newham, and Southwark. In 2025 75% of Islington’s LSOAs were in the top 20% most deprived deciles in the country. Nearly half (49%) of LSOAs are in the top 10% of income deprivation affecting older people.
Map 3: Map of Islington IDAOPI by LSOAs, by national deprivation deciles, 2025 IMD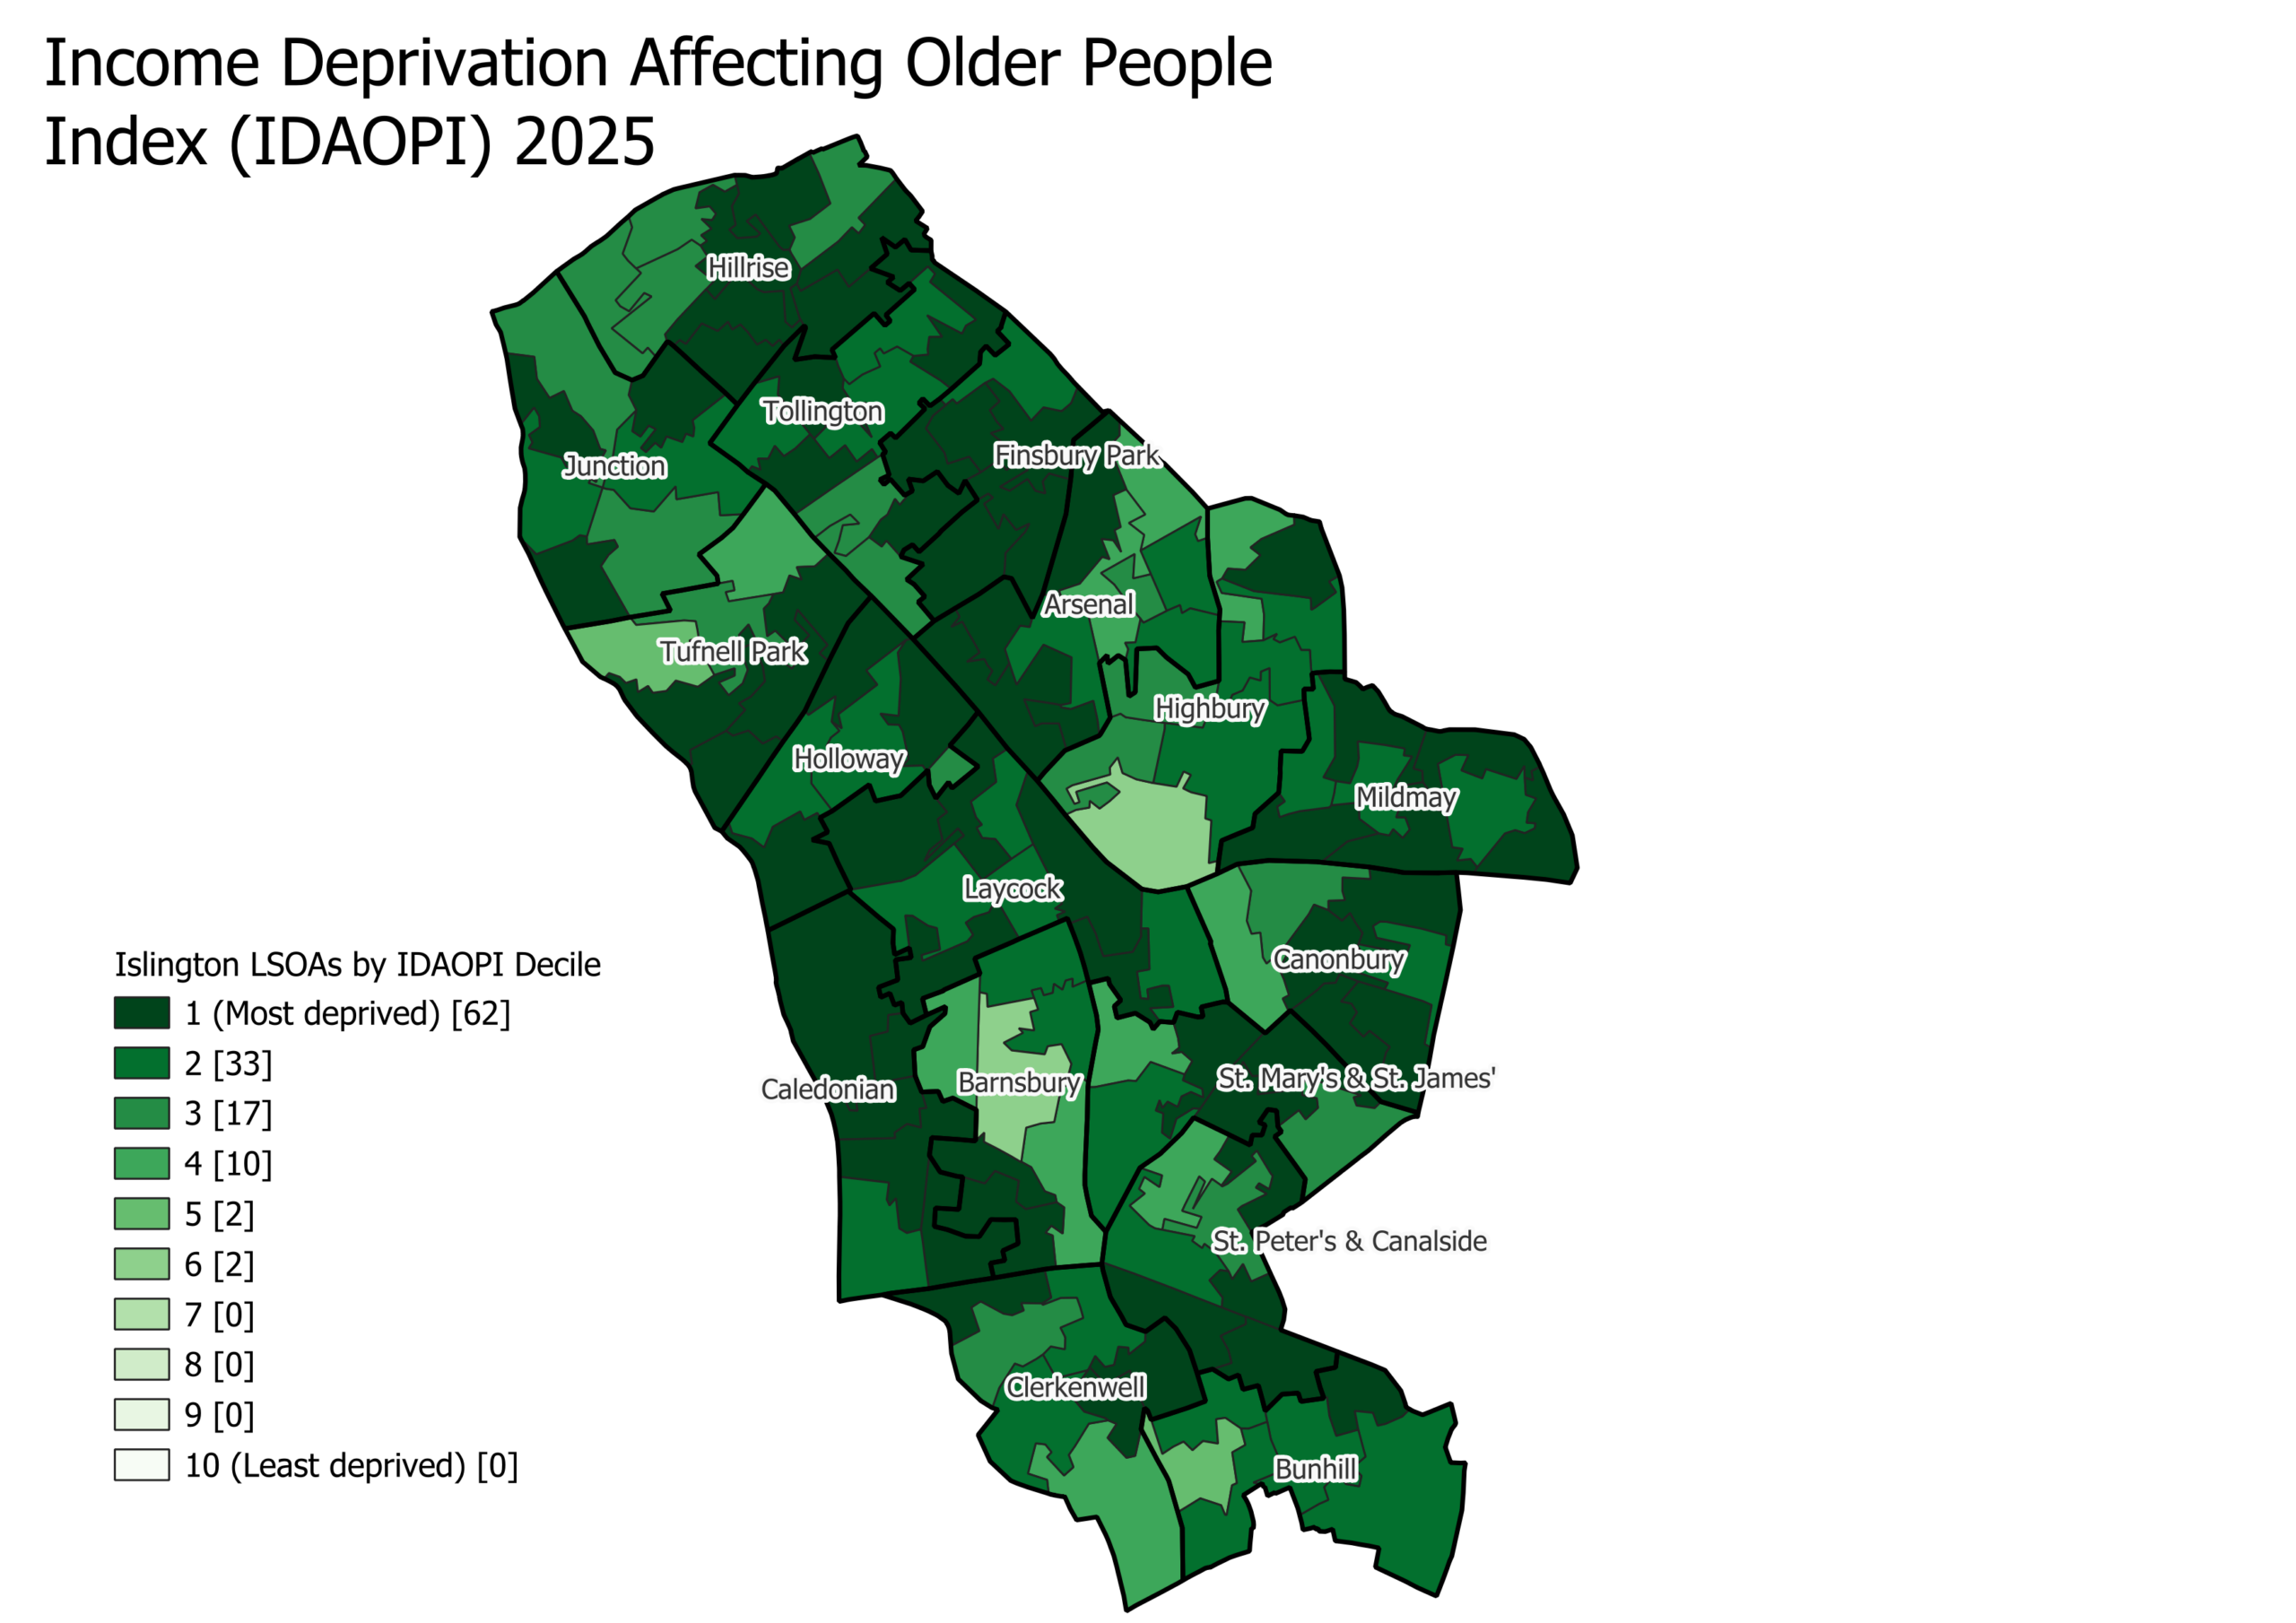
Methodology used in this briefing
How is Islington ranked?
Islington’s ranking is based on the “rank of average score” method for upper-tier local authorities. This approach has been selected to align with the methodology used in Fair Funding 2.0. At the time of publication, there were 153 upper-tier local authorities in England.
What is the average score?
The average score summary measure is calculated by averaging the LSOA scores in each larger area after they have been population weighted. The resultant scores for the larger areas are then ranked, where the rank of 1 (most deprived) is given to the area with the highest score.
What are LSOAs?
A Lower Layer Super Output Area (LSOA) is a small geographic area, used for reporting small area statistics in England and Wales. Postcodes are grouped together based on similar socio-demographic characteristics and contain about 1500 residents on average.
What is a decile?
To allow easier comparisons, areas are grouped in to 10 equal groups, called deciles, to allow us to look at the most deprived 10%, least deprived 10%, and so on.
IMD 2025 methodology changes
Due to changes in methodology, data sources, and geography, scores are not directly comparable with previous versions. Comparisons should be made using rank changes rather than absolute scores, and with appropriate caveats. Please see the technical report for details of the methodology and changes compared to 2019.
Useful links
English indices of deprivation 2025: statistical release
English indices of deprivation 2025: technical report2025
English indices of deprivation 2025 – GOV.UK
Report produced by:
Cintia Liberatoscioli – Public Health Intelligence Analyst
Fleur Harrison – Senior Health and Care Analyst
Evie Lodge – Principal Intelligence Specialist
Report reviewed by:
Adam White – Head of Data & Performance, Children and Young People
Charlotte Ashton – Consultant in Public Health